

Up-revisions pushed the 12-month core PCE price index for February to +3.0%, and the 6-month index to +3.4%, worst since July 2023. But March was benign?
By Wolf Richter for WOLF STREET.
The inflation measure released today for March – the PCE price index favored by the Fed as yardstick for its inflation target – has a salient feature that it had many times before: Sharp up-revisions of the prior month’s data, this time for February, triggered by hot up-revisions in core services inflation.
The February month-to-month data were revised sharply higher today, driven by core services which dominates the overall index.
- Overall PCE: to +0.44% (5.5% annualized), from originally +0.33% (+4.0% annualized)
- Core PCE: to 0.50% (+6.1% annualized), from originally +0.37% (+4.5% annualized)
- Core services: to +0.52% (+6.5% annualized), from originally +0.35% (+4.3% annualized).
The February year-over-year readings were also revised higher, which caused the core PCE price index for February to hit +3.0%, highest in a year:
- Overall PCE: to +2.7%, originally +2.5%.
- Core PCE: to +3.0%, originally +2.8%.
- Core services: to +3.8%, originally +3.6%.
In March, the price changes were from the up-revised February levels.
On a year-over-year basis in March:
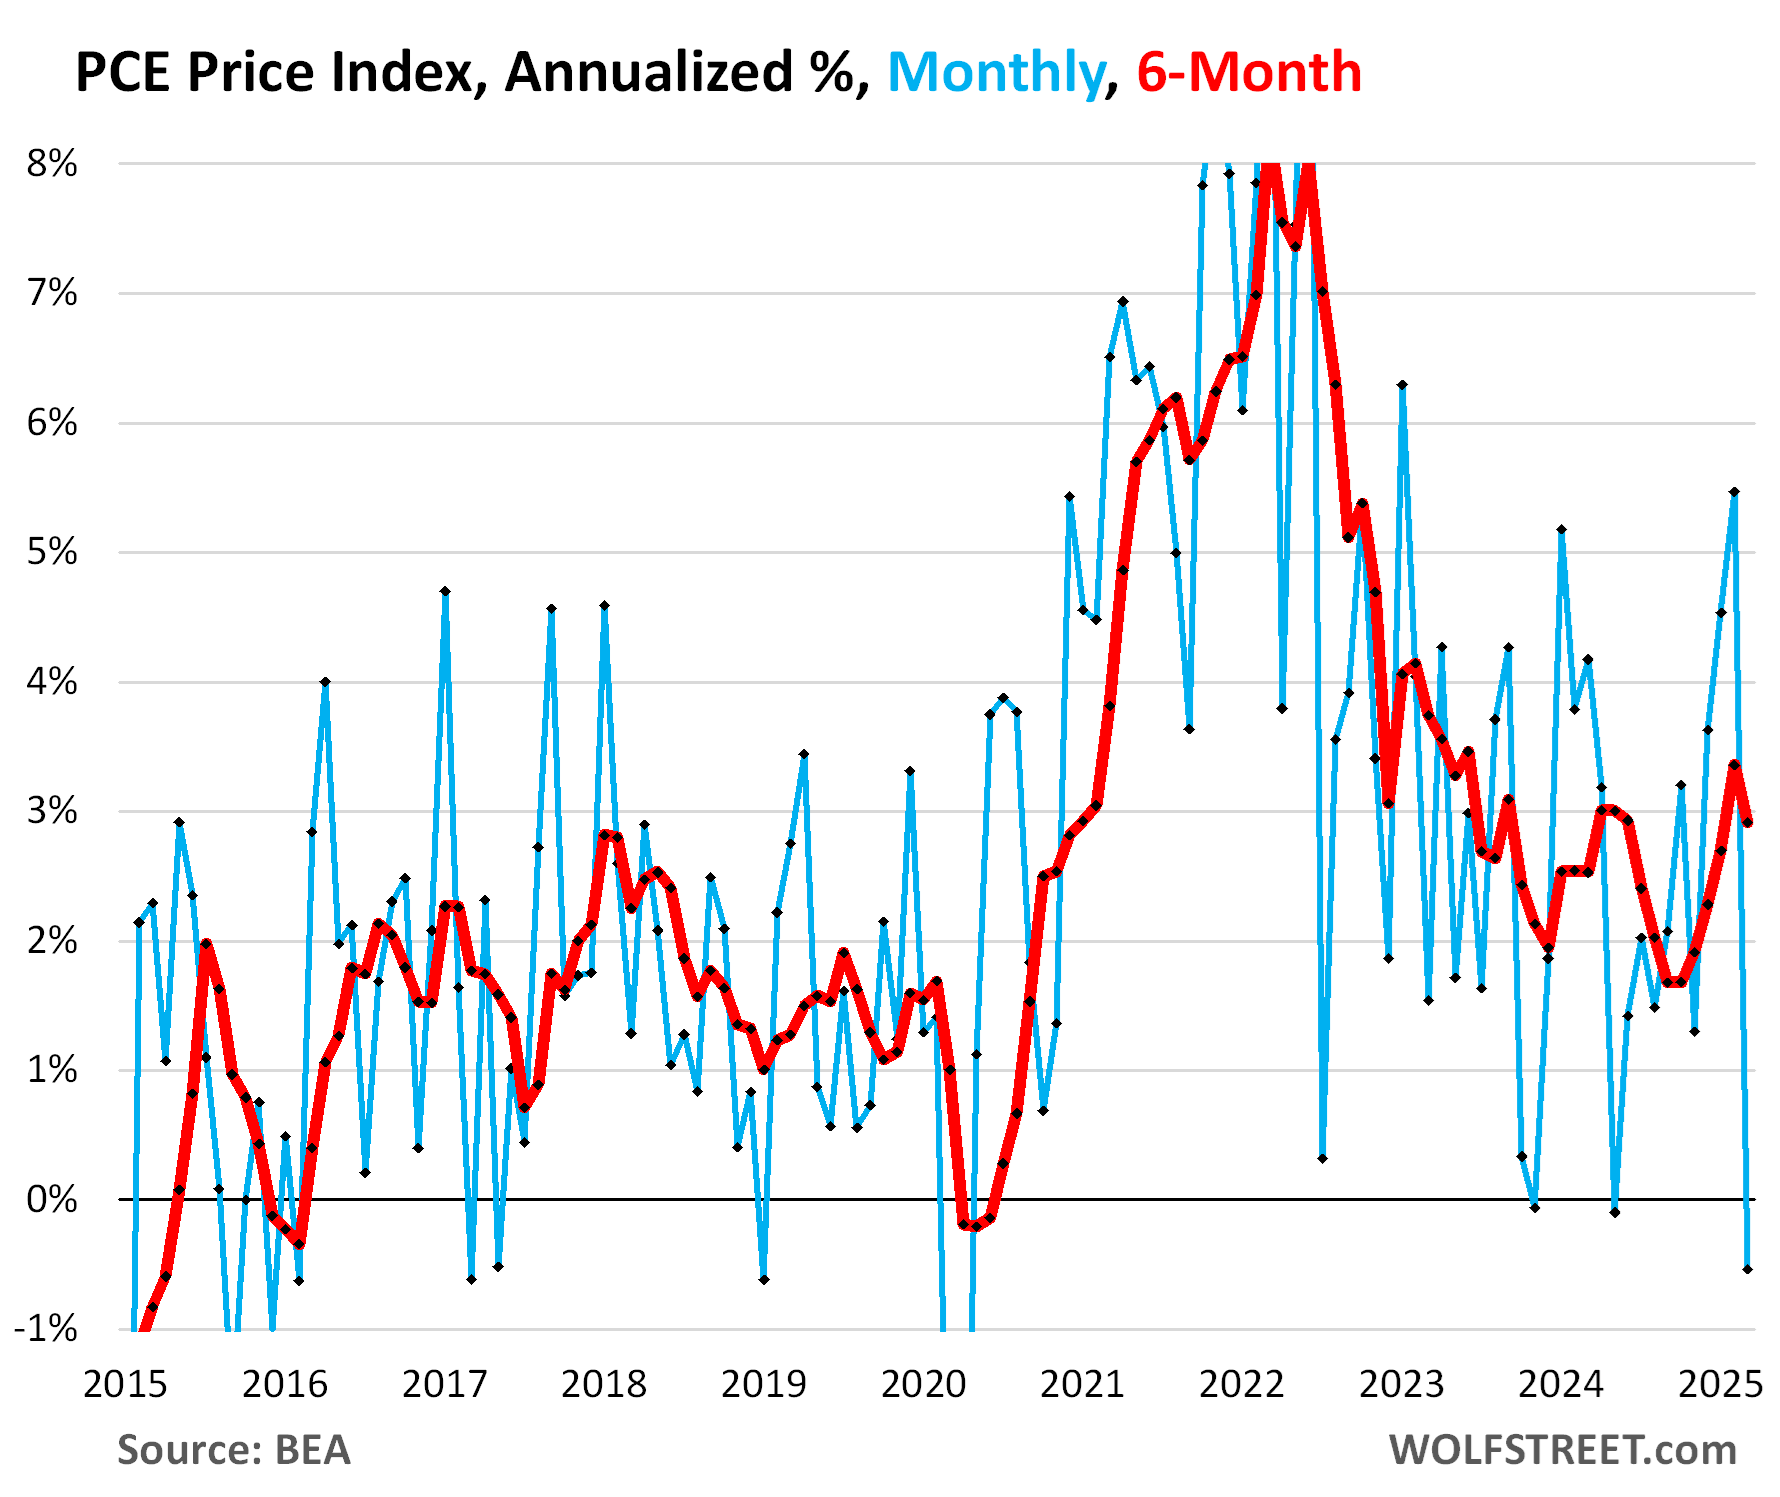
- Overall PCE price index (red): +2.3%, driven down in part by plunging energy costs. The Fed’s target is 2.0%.
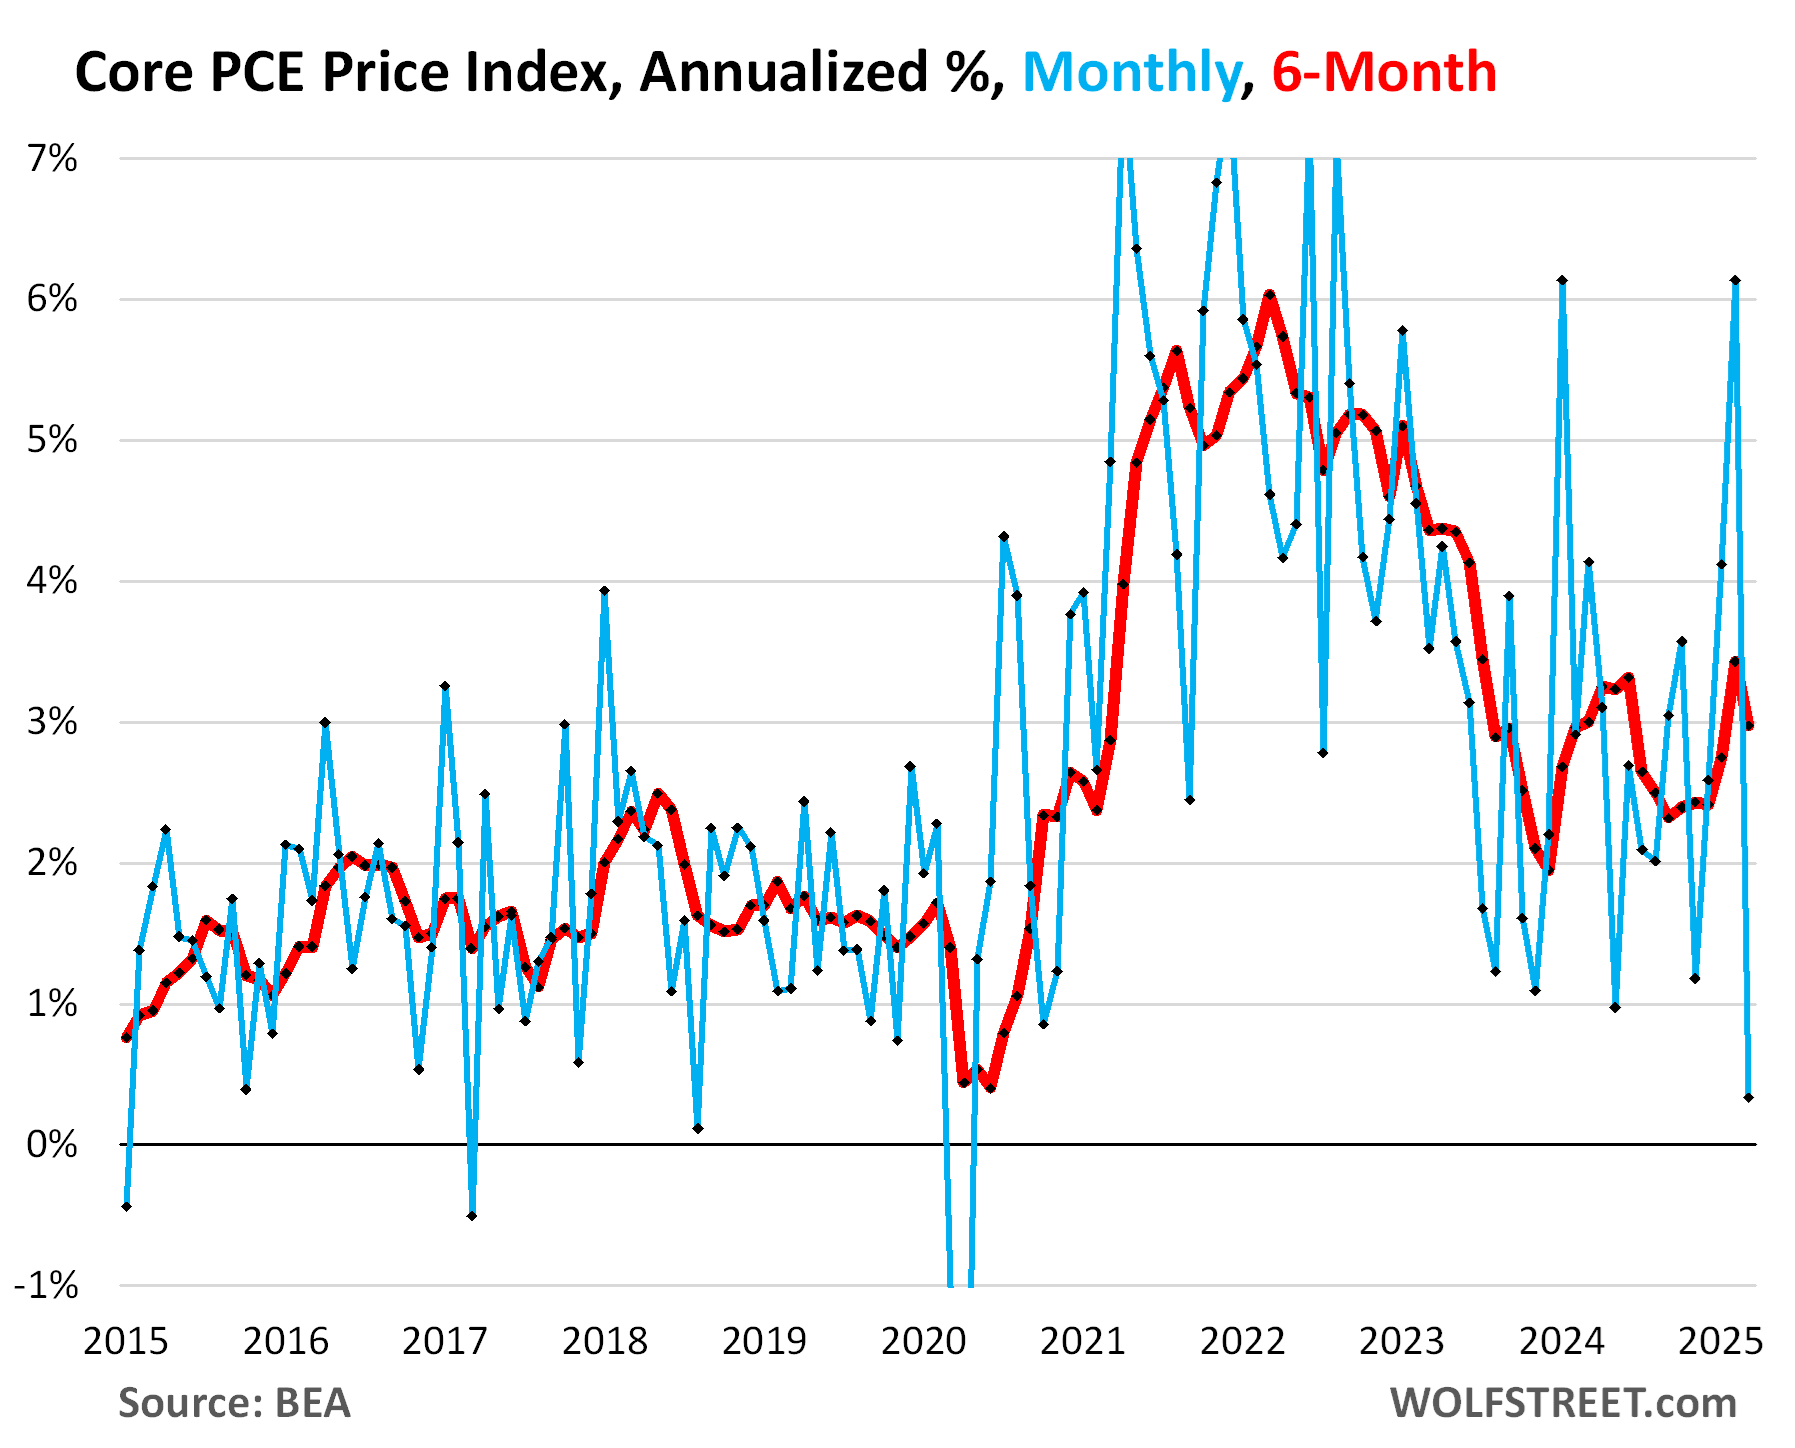
- Core PCE price index (blue): +2.6%
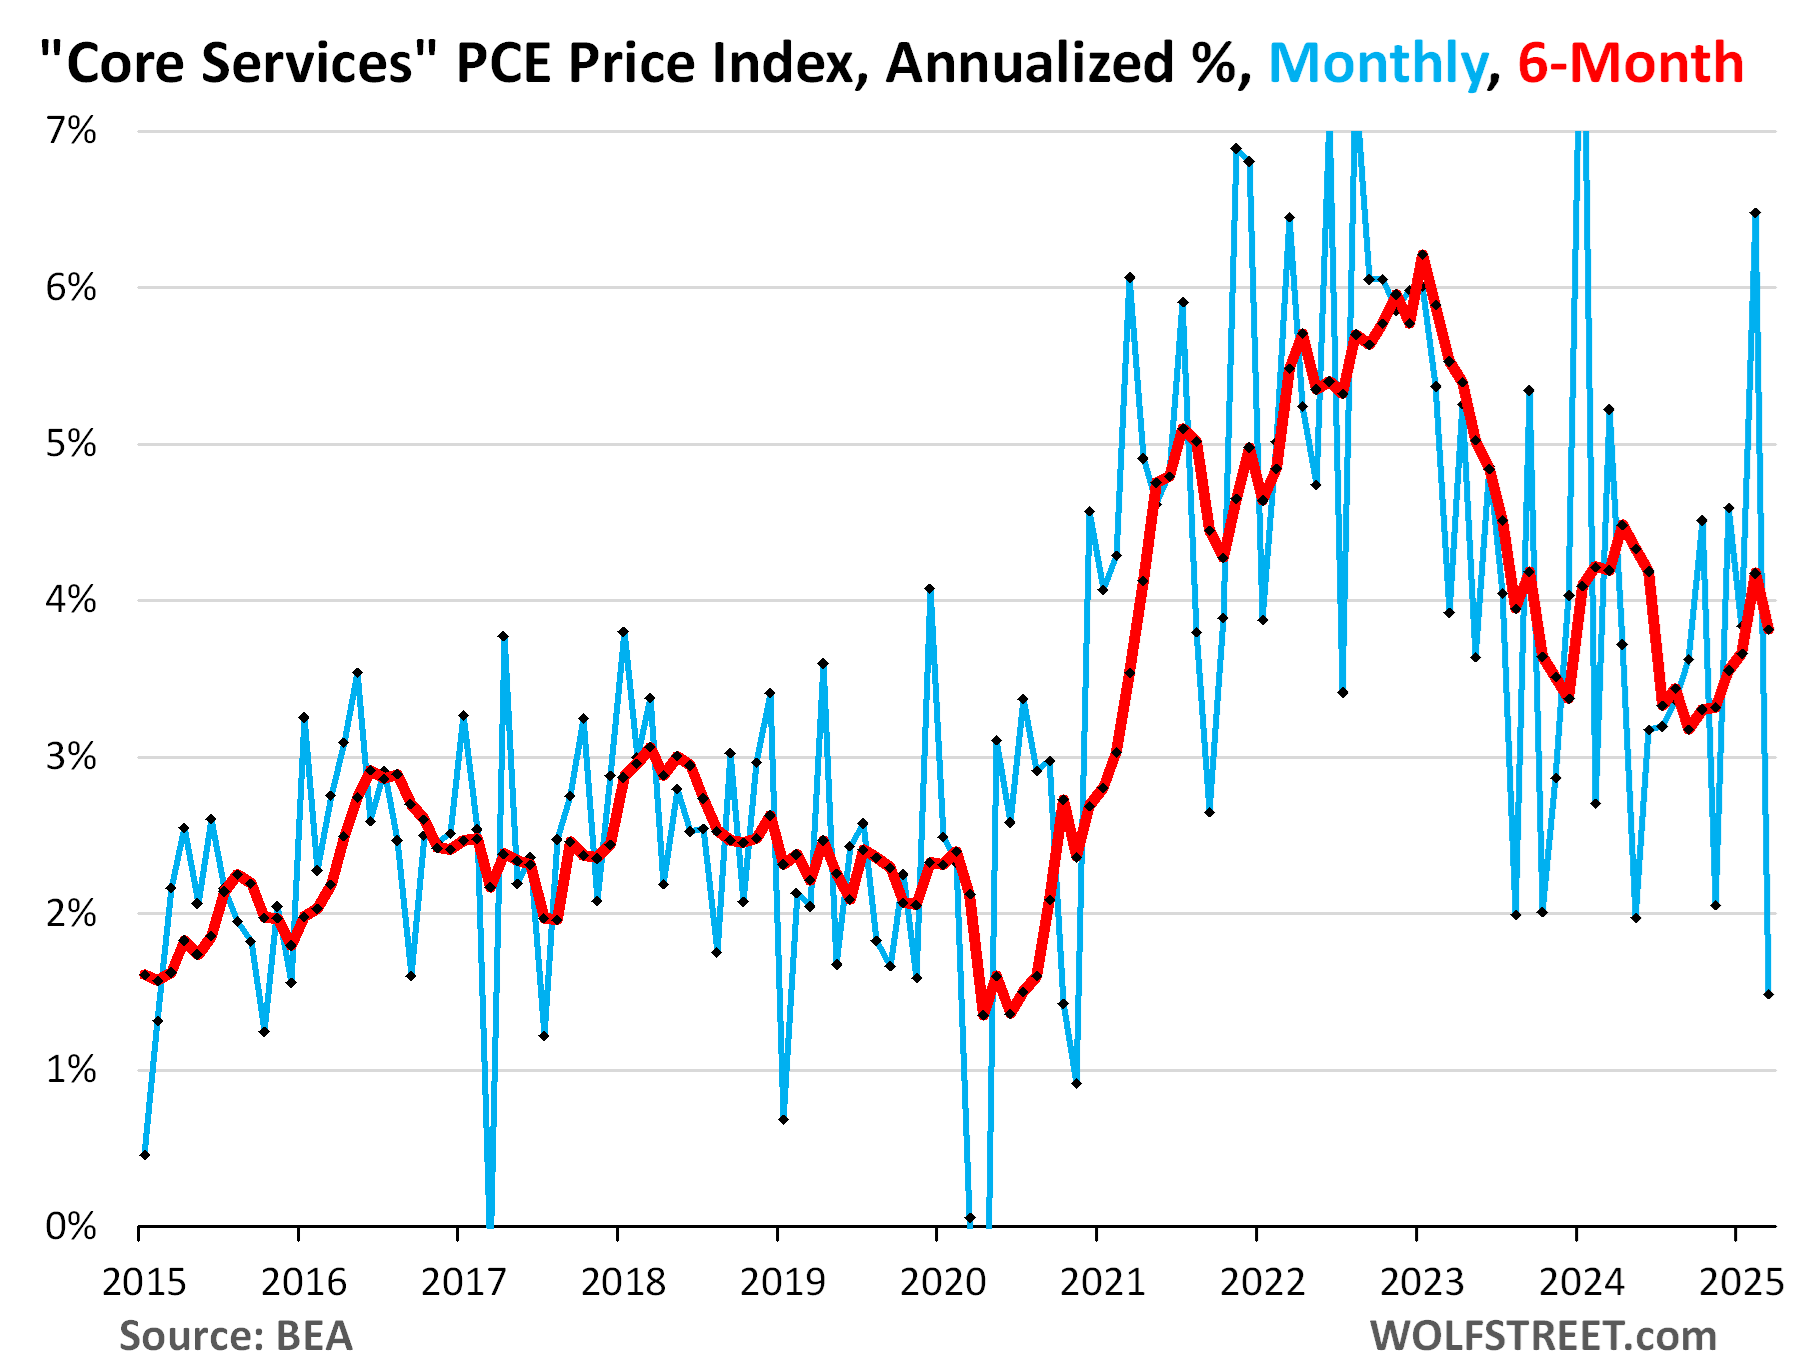
- Core Services PCE price index (gold): +3.5%.
- Durable goods price index (green): -1.0%.

The overall PCE price index edged down by 0.04% (-0.5% annualized) in March, from the up-revised red-hot level in February (+5.5% annualized, the worst since January 2023). The March dip was driven by a 2.7% month-to-month plunge (-28% annualized) in the energy price index.
The 6-month PCE price index decelerated to +2.9%, from February’s up-revised 3.4%, which had been the worst increase since June 2023.
The core PCE price index, which excludes food and energy items, decelerated in March to +0.03% (+0.3% annualized), from the heavily up-revised level in February (+6.1% annualized).
The 6-month core PCE price index (red) decelerated to +3.0% annualized. But February was revised up to 3.4%, the biggest increase since July 2023, from originally 3.1%, which had been the biggest since June 2024. Inflation is in the revisions?
The core services PCE Price Index, which excludes energy services, decelerated in March to +0.12% (+1.5% annualized) from the red-hot up-revised February.
The 6-month core services PCE price index decelerated to +3.8% from the up-revised 4.2% in February.
Inflation is in the revisions? The originally reported 6-month core services PCE for February had accelerated to +3.7% annualized, and it was up-revised today to a +4.2%. And so today’s readings for March, at +3.8%, would be an acceleration from the originally reported February reading (+3.7%).
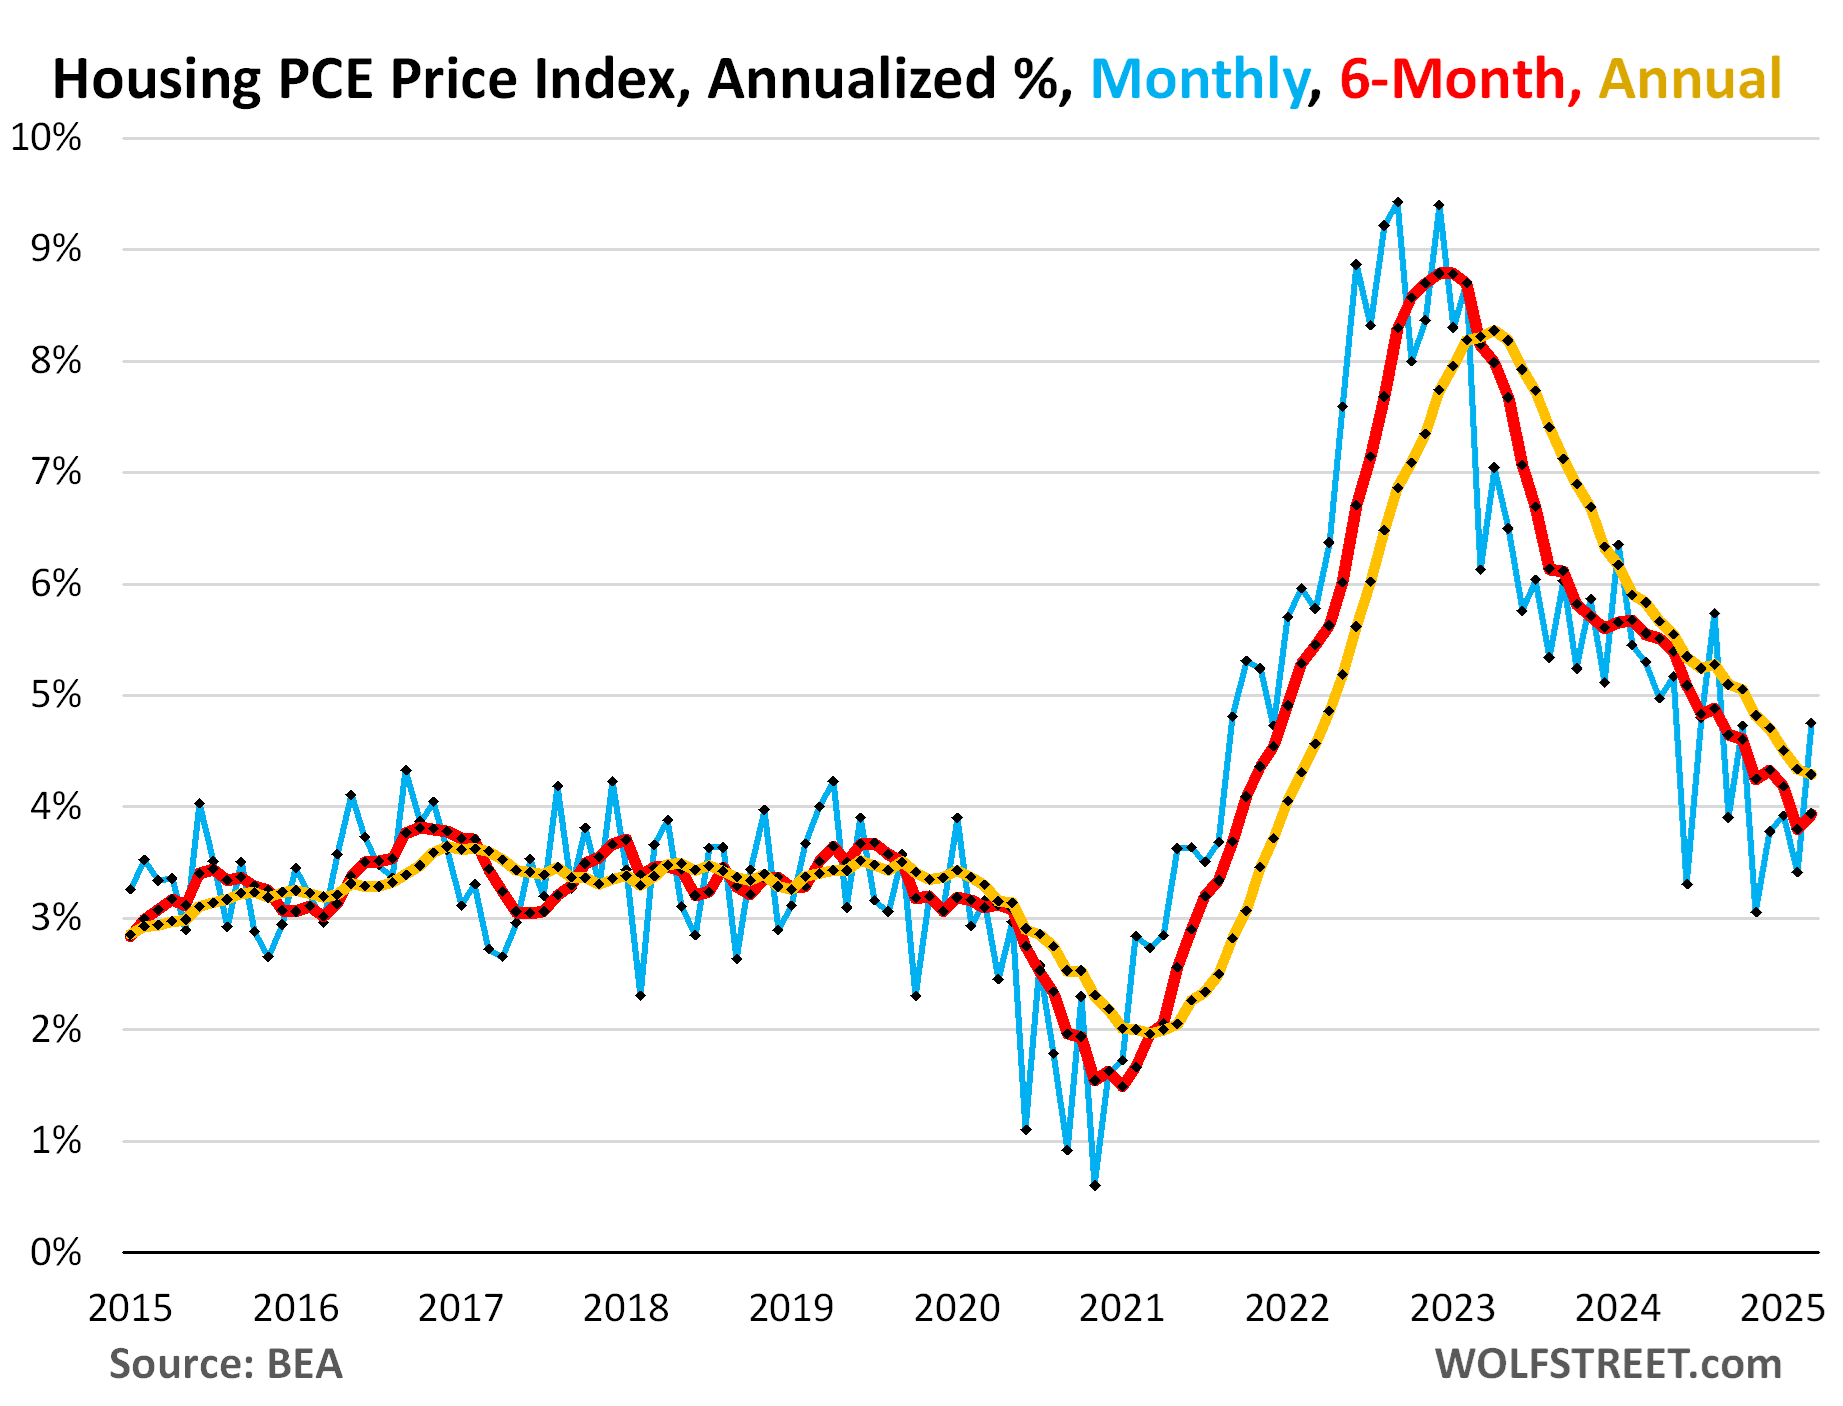
Housing inflation accelerated. The PCE price index for housing – one of the main components of core services – is based various rent factors. It surged by 0.39% (4.8% annualized), the biggest month-to-month increase since August 2024, having accelerated in a zig-zag manner since the low point in November last year (blue in the chart below).
The six-month index has now accelerated to 3.9% annualized (red in the chart below).
The year-over-year index has slowed its deceleration to nearly unchanged at +4.29%, from February’s 4.33% (yellow):
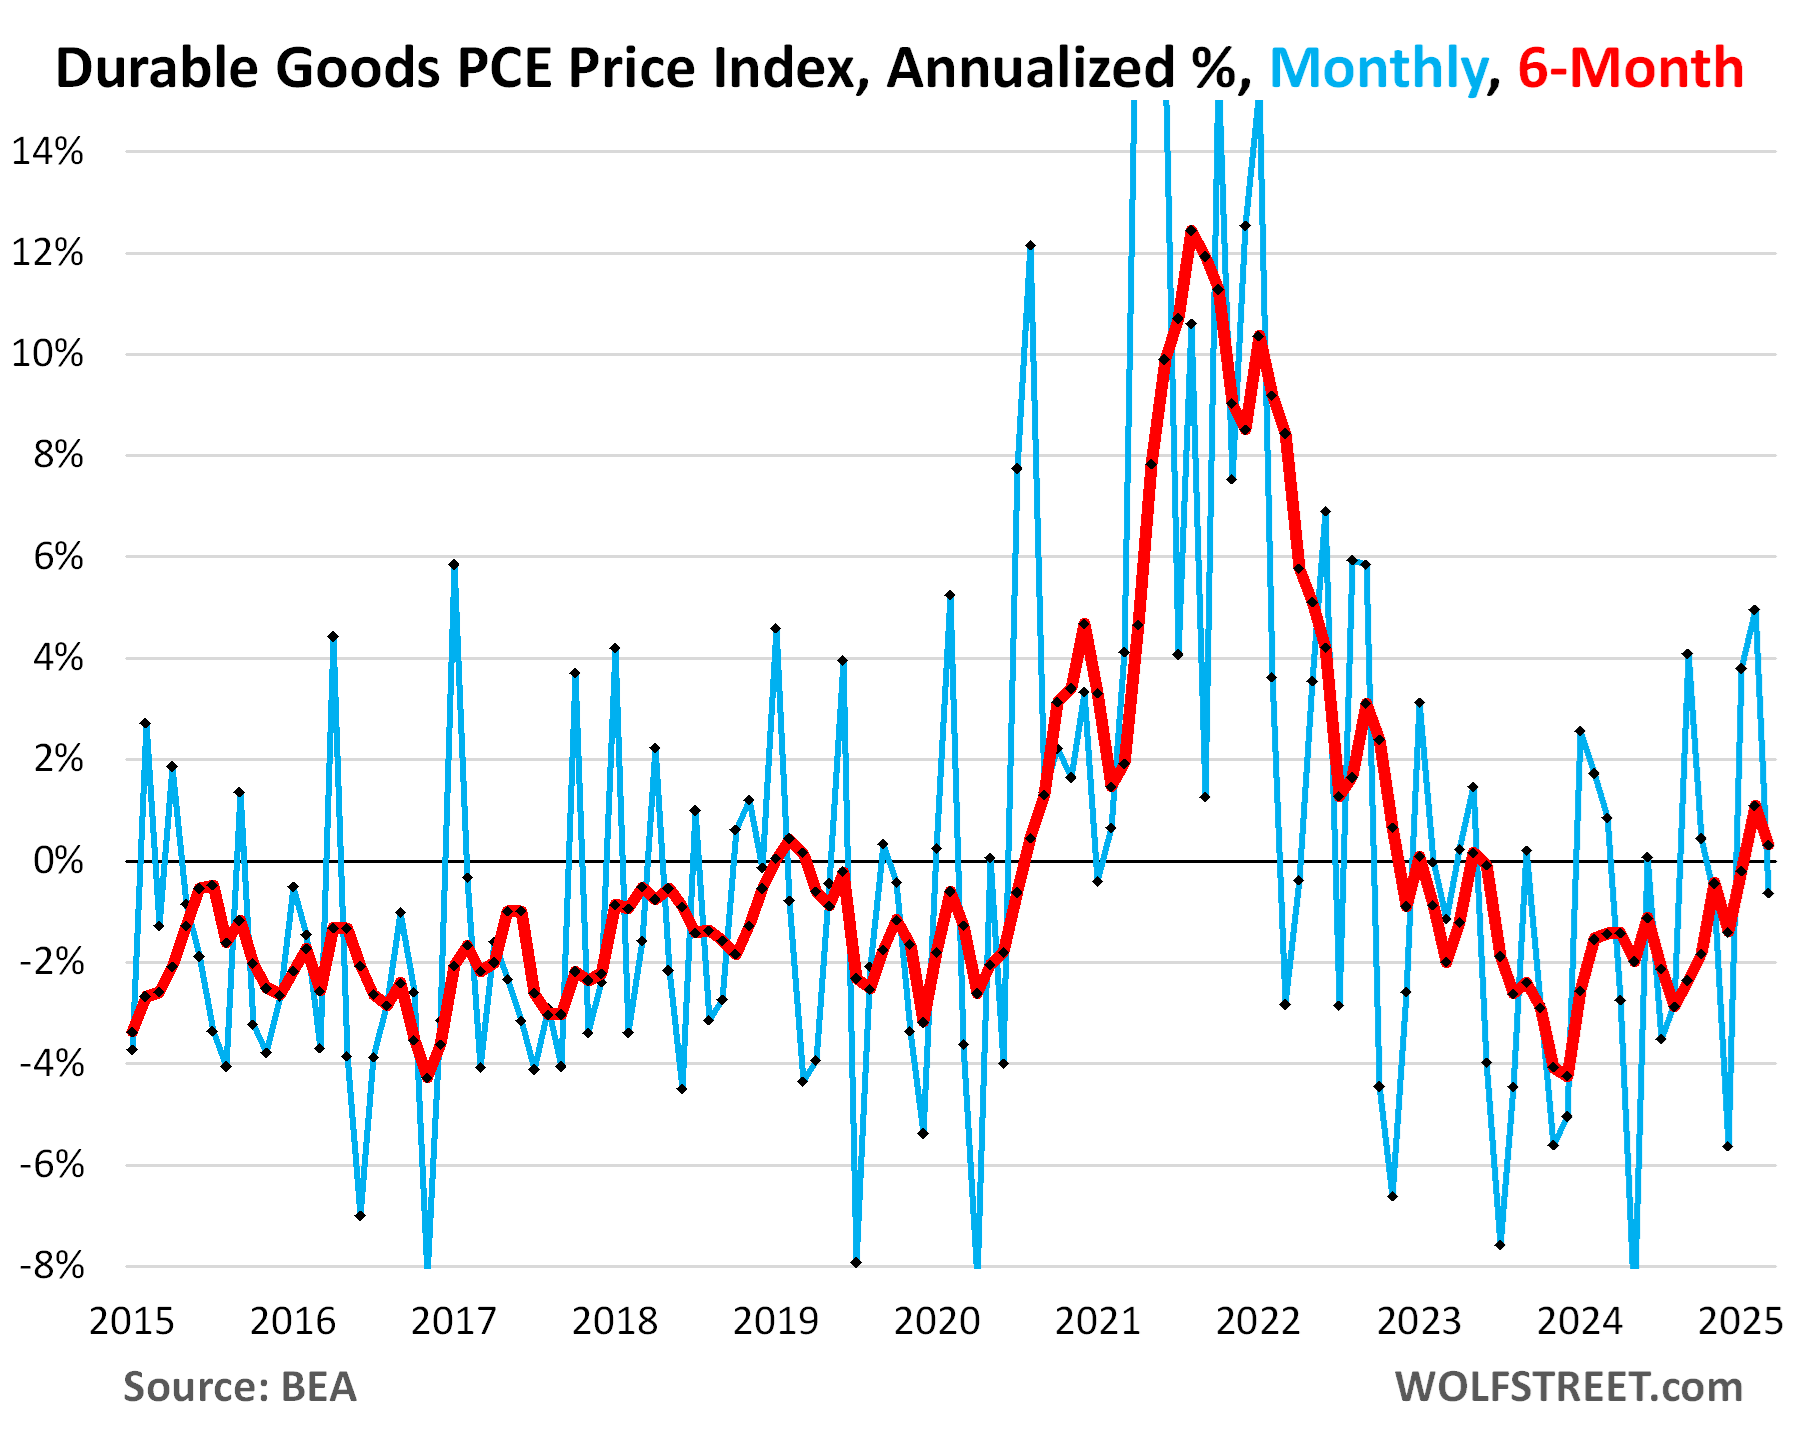
Durable goods prices declined in March from February by 0.05% (-1.0% annualized). They’ve been zigzagging up from the deeply negative hole since early 2024, and the negative reading in March, after two positive readings, might just have been another zag.
The six-month PCE Price index for durable goods shows the trend: It started heading higher in September last year, from deep deflation (negative), and became less negative as it went, was barely negative by January, turned positive in February, and remained positive in March at +0.31% annualized. Durable goods have been in deflation for many years before the pandemic due to manufacturing efficiencies, offshoring production to cheap countries, and other factors.
Durable goods include motor vehicles, appliances, consumer electronics, furniture, etc. Many of these products or their components and materials are produced overseas and are subjected to new tariffs. But that hasn’t left any traces on retail prices yet. And it didn’t leave a lot of traces last time tariffs were imposed in late 2018, as you can see in the chart. It’s the inflation coming out of the pandemic that had a huge impact on prices of durable goods.
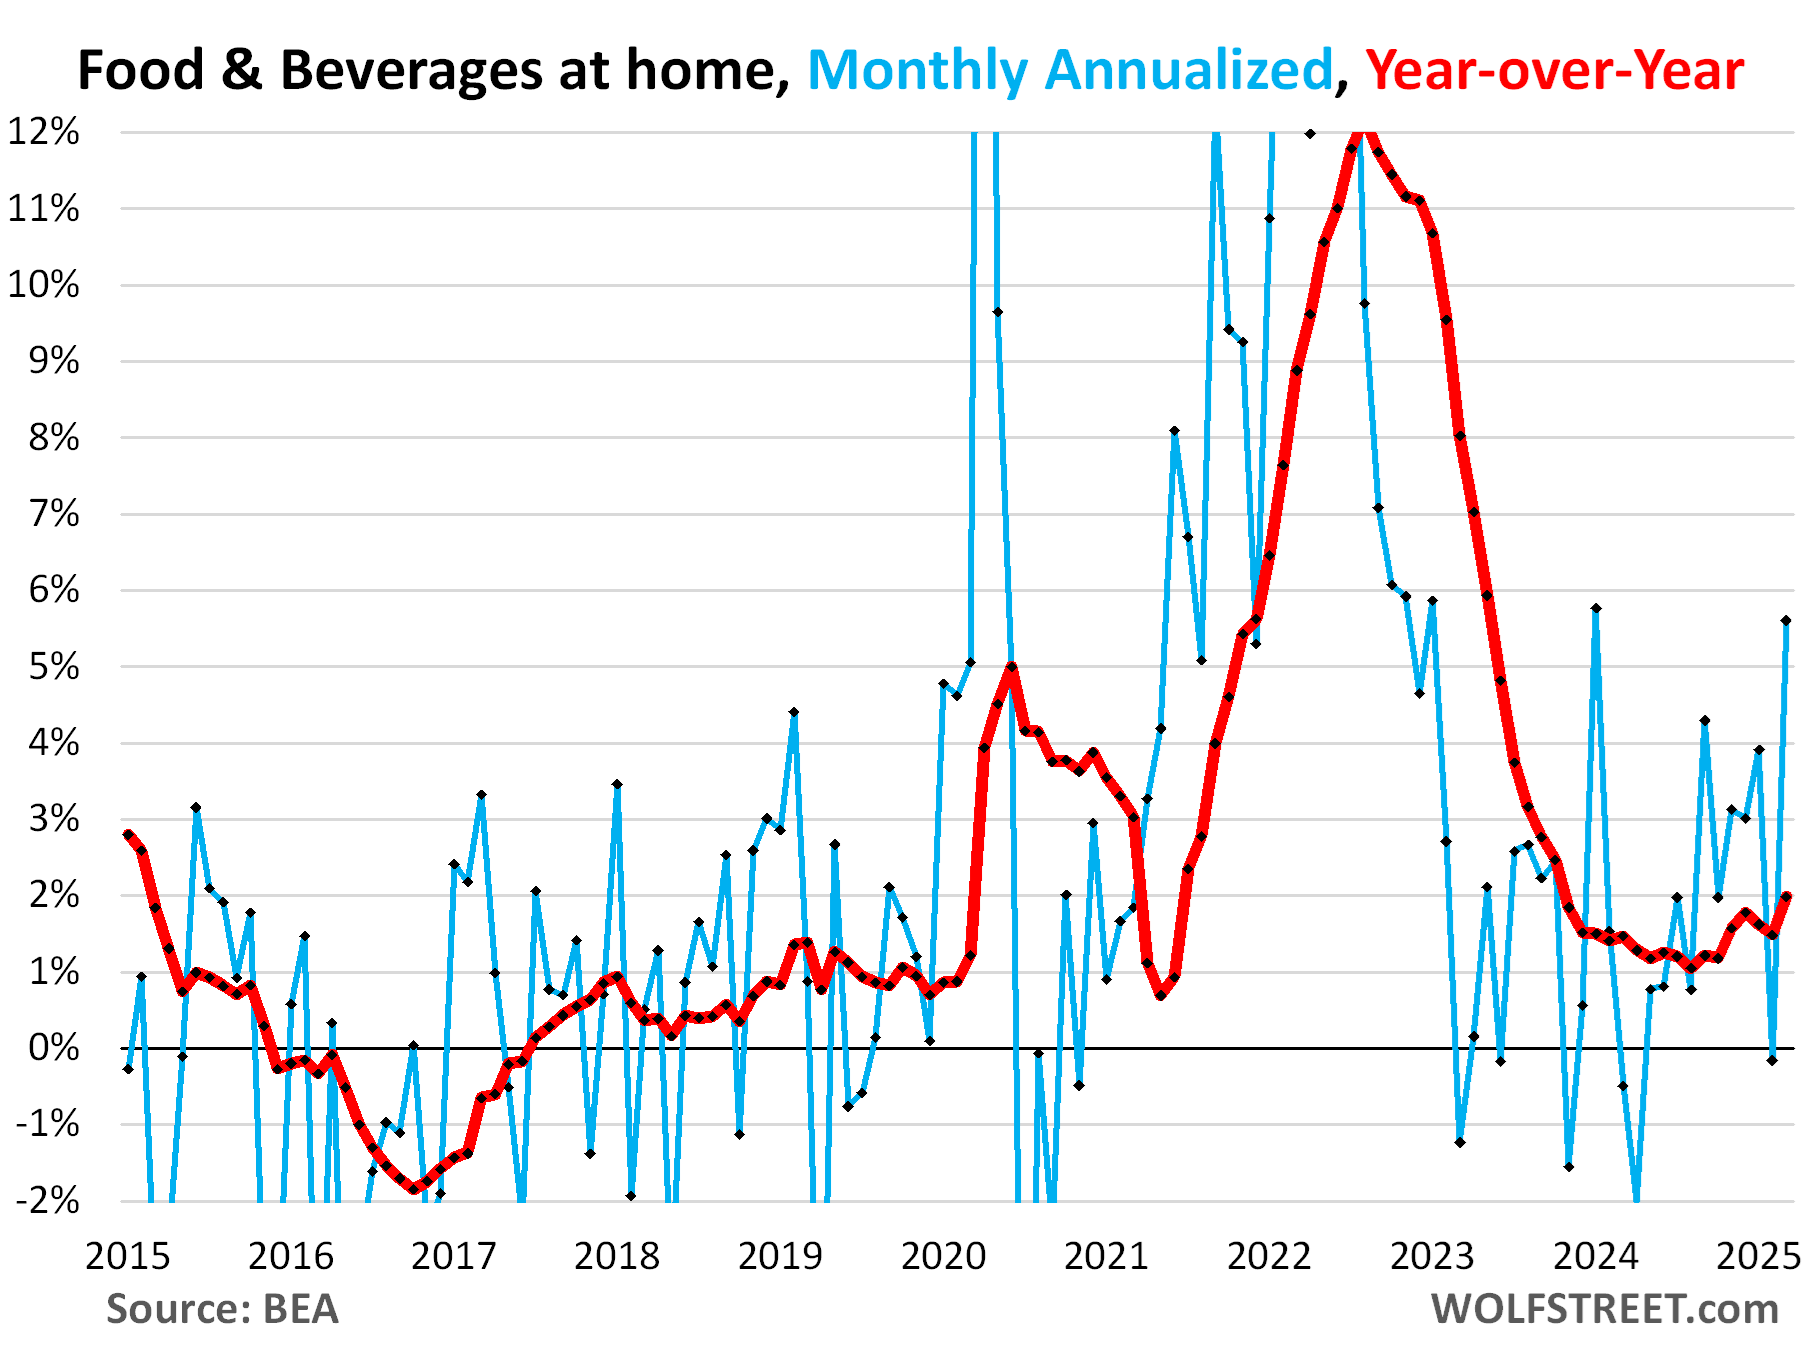
Food and beverage prices surged by 0.46% in March from February (+5.6% annualized), and have been zigzagging higher from the low point about a year ago. These are food and beverage products that consumers buy to consume off premise. They do not include food and beverages consumed on premise, such as at restaurants, bars, cafes, etc.
The year-over-year food price index (red line) has been accelerating since mid-2024 and in March rose by 2.0%.
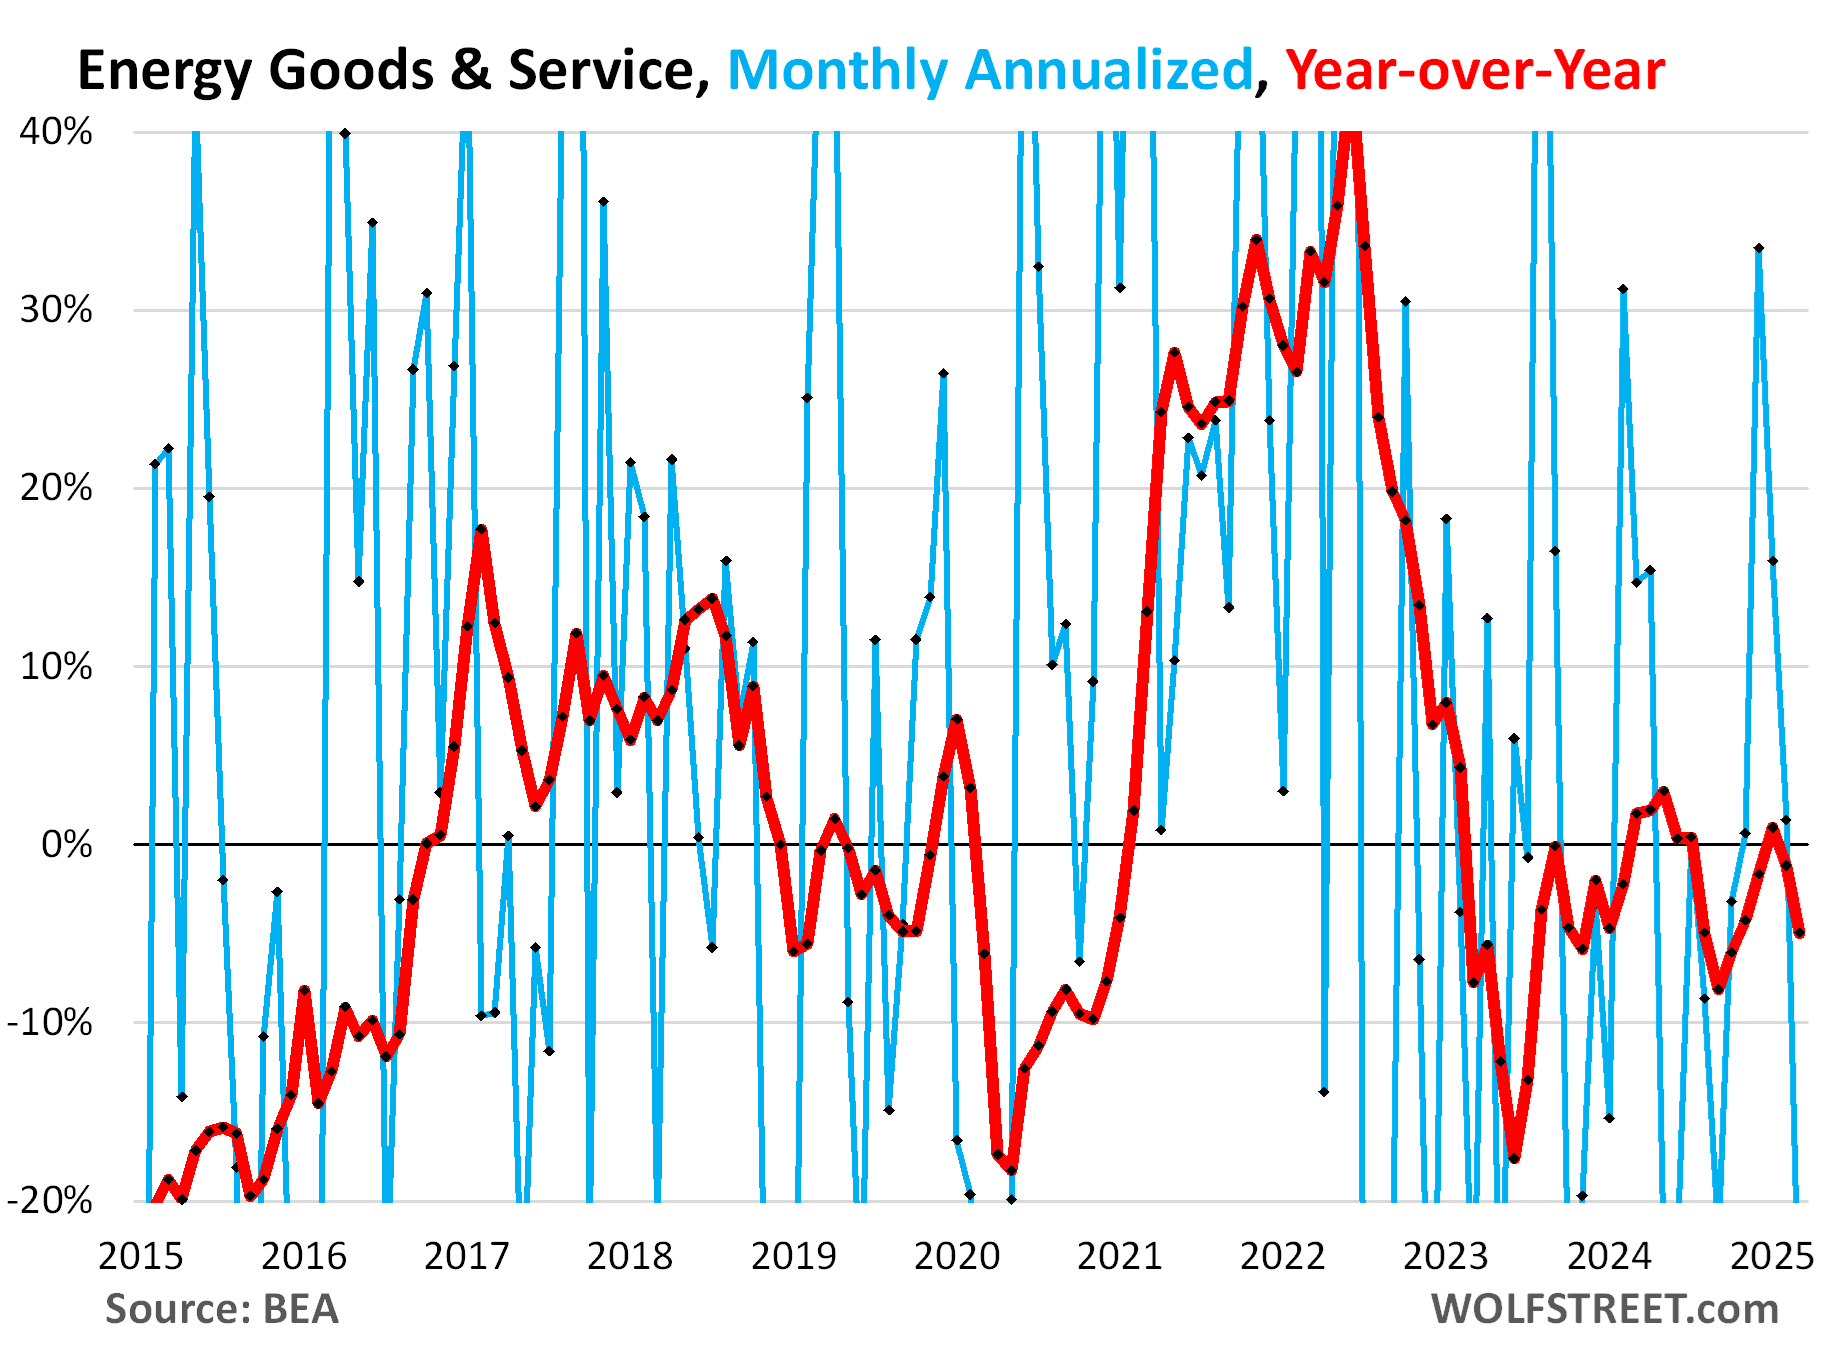
Energy prices plunged by 2.7% in March from February (-28% annualized), driven by the plunge in gasoline prices, which followed oil prices down. Year-over-year (red), the index fell 5.6%.
Energy is a hugely volatile category, along with food, both driven by commodity prices, which is why “core” inflation measures that remove energy and food were conceived to reveal underlying inflation trends.
Enjoy reading WOLF STREET and want to support it? You can donate. I appreciate it immensely. Click on the mug to find out how:

![]()